Experiment geometry
HiSPoD works for both reflection and transmission geometries, as shown in Fig. 2. For polycrystalline samples, these two geometries are fundamentally the same, and the only difference is that in transmission geometry, the energy spectrum will be modified due to the sample absorption. Usually, the lower the energy, the higher the intensity attenuation is. The exceptions occur at the sample absorption edges, which are normally lower than the 1st harmonic energy and thereby can be ignored most of the time. A function called “Load absorption file” can be used for taking into account the absorption effect of the sample when quantitative simulation is desired. Details will be introduced in following sections.
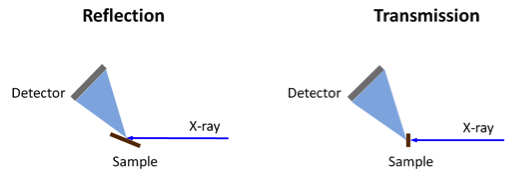
Figure 2: Reflection and transmission experiment geometries
In the experiment, the detector is placed with detection plane perpendicular to the ground, as shown in Fig. 3. The position of the detector could be rather arbitrary. It’s recommended that the detector is mounted and moved in the “Circular track” geometry, such as the case of mounting the detector on a diffractometer arm for the ease of getting the direct beam X and Y values.
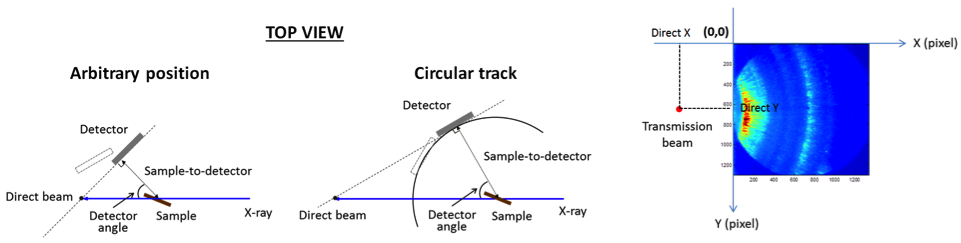
Figure 3: Position of the detector