Introduction
HiSPoD is a Matlab® program, which runs in both Windows and Mac systems. Imaging Processing Toolbox is required for using some of the functions of this program.
HiSPoD is developed for simulating and analyzing undulator white-beam diffraction patterns from polycrystalline samples. It is particularly useful when (1) one deals with noisy diffraction patterns, i.e. single-pulse pattern collected using intensified CCD), (2) an area detector is placed with an offset angle from the incident direction, i.e. the detection plane is not perpendicular to the incident beam while the transmission spot may not fall on the detector, and (3) diffraction peaks from multiple x-ray harmonic energies co-exist. The major functions of this GUI include:
Simulate 2D diffraction pattern from a sample under a given experiment condition
- Analyze 2D diffraction patterns
- Estimate transmission beam position
- Define region of interest (i.e. apply mask)
- Calculate map of reciprocal wavevector q
- Extract 1D intensity profiles I(tth) and I(q) via radially averaging
- Index (hkl) and harmonic peaks
Perform curve fitting to quantify strain and phase content
HiSPoD aims at providing users with an effective tool for (1) designing experiments by predicting sample diffraction patterns before the visit to the synchrotron facility, (2) optimizing parameters and adjusting work plan by quickly analyzing the experiment data on site, and (3) fully understanding the data and quantifying the results by curve fitting after going back to home institution.
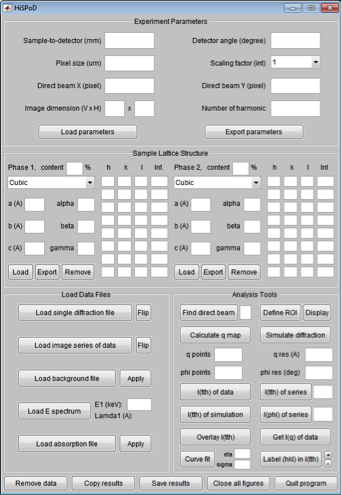
Figure 1 HiSPoD interface
HiSPoD consists of four modules:
- “Experiment Parameters”: users input the parameters associated with the detector and experiment geometry.
- “Sample Lattice Structure”: users input the standard powder diffraction intensities of the sample. Such information can be obtained from the International Centre for Diffraction Data, in-house diffraction experiments, or commercial software, such as CrystalMaker.
- “Load Data Files”: in this module, users load the raw data, background file, energy spectrum, and absorption file.
- “Analysis Tools”: this module contains multiple tools for users to perform data analysis.